Wind Flow Animation
NOAA Global Forecast System
Coverage: Global · Update frequency: Every 6 hours · Format: GRIB2 (U/V components)
Overview
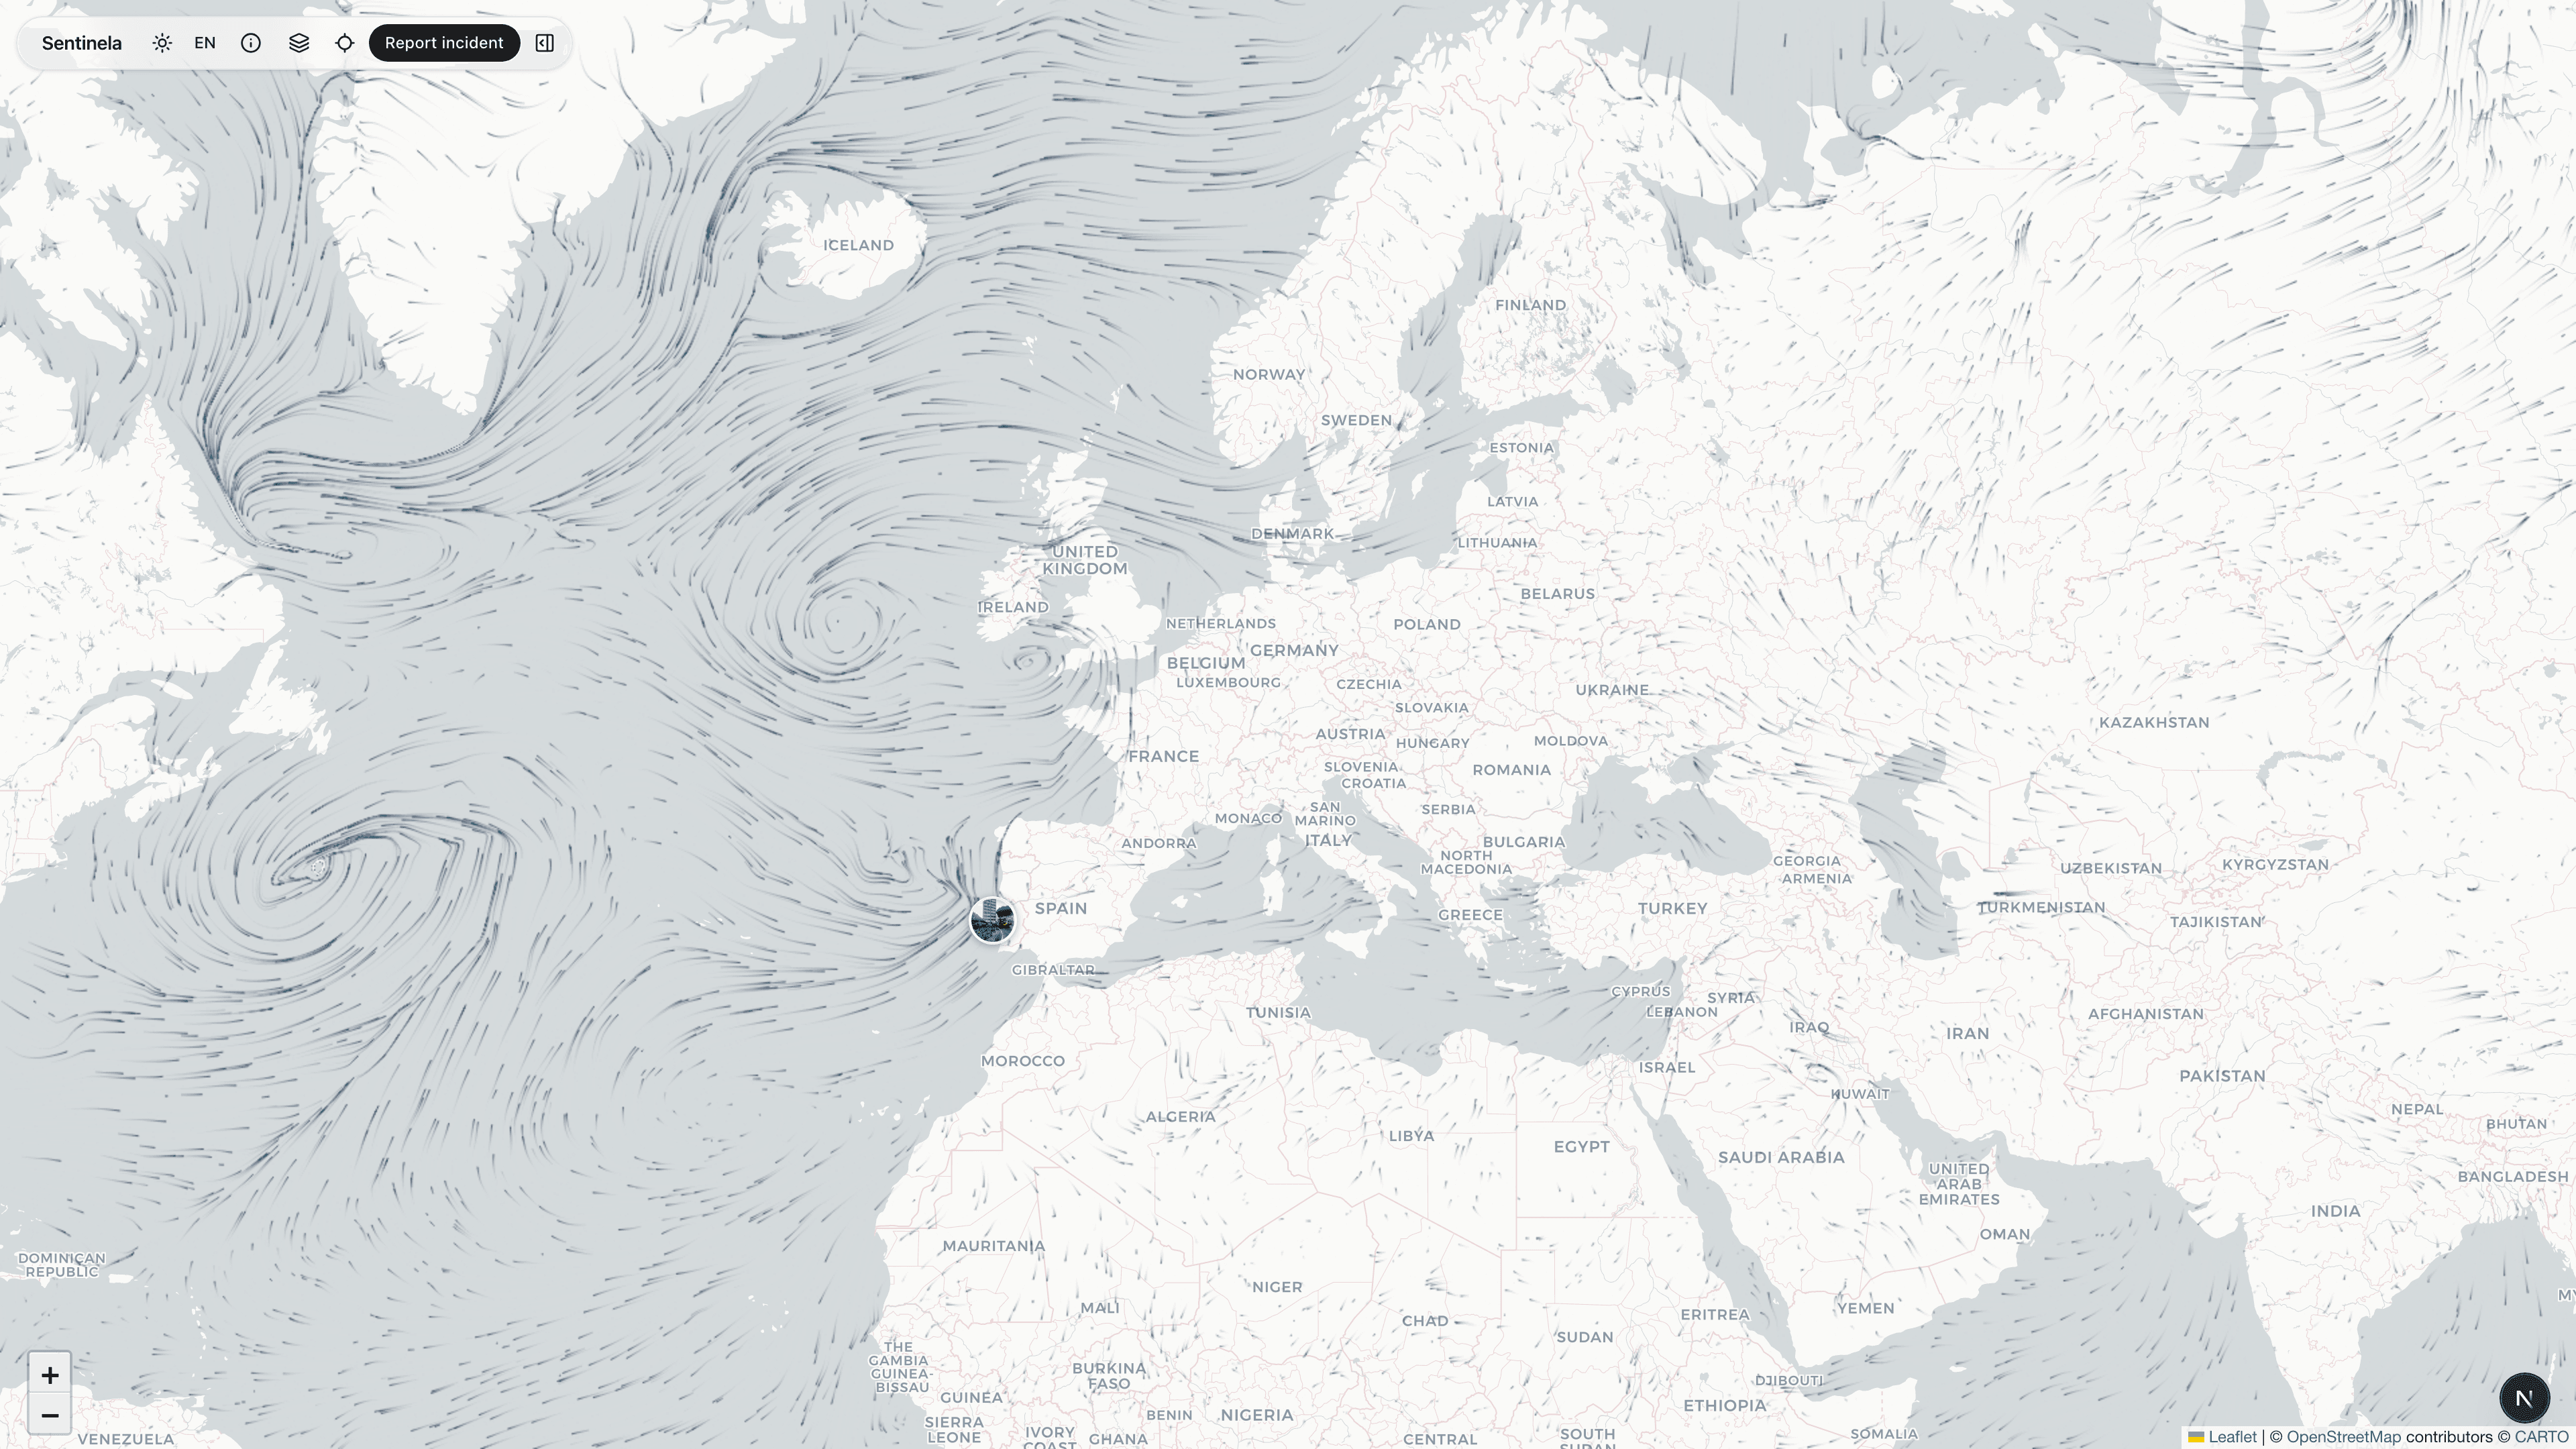
Wind flow visualization uses U and V wind component data from the GFS model to create an animated particle flow showing wind direction and speed. This provides an intuitive view of atmospheric circulation patterns.
How Sentinela Uses This Data
When enabled, animated particles flow across the map following wind vectors. Particle speed indicates wind strength, and flow patterns reveal features like jet streams, cyclones, and trade winds.
Data Processing
We extract 10m U and V wind components from GFS data and create a vector field. The animation uses WebGL to efficiently render thousands of particles that follow the wind field.
Limitations & Considerations
The animation shows surface winds (10m height) which may differ from winds at other altitudes. Particle density is balanced between visual clarity and performance. Very light winds may not show obvious movement.