Sea Surface Temperature
NOAA OISST - Optimum Interpolation SST
Coverage: Global oceans · Update frequency: Daily · Format: NetCDF
Overview
NOAA's Optimum Interpolation Sea Surface Temperature (OISST) combines observations from ships, buoys, and satellites to produce a daily global SST analysis at 0.25° resolution.
How Sentinela Uses This Data
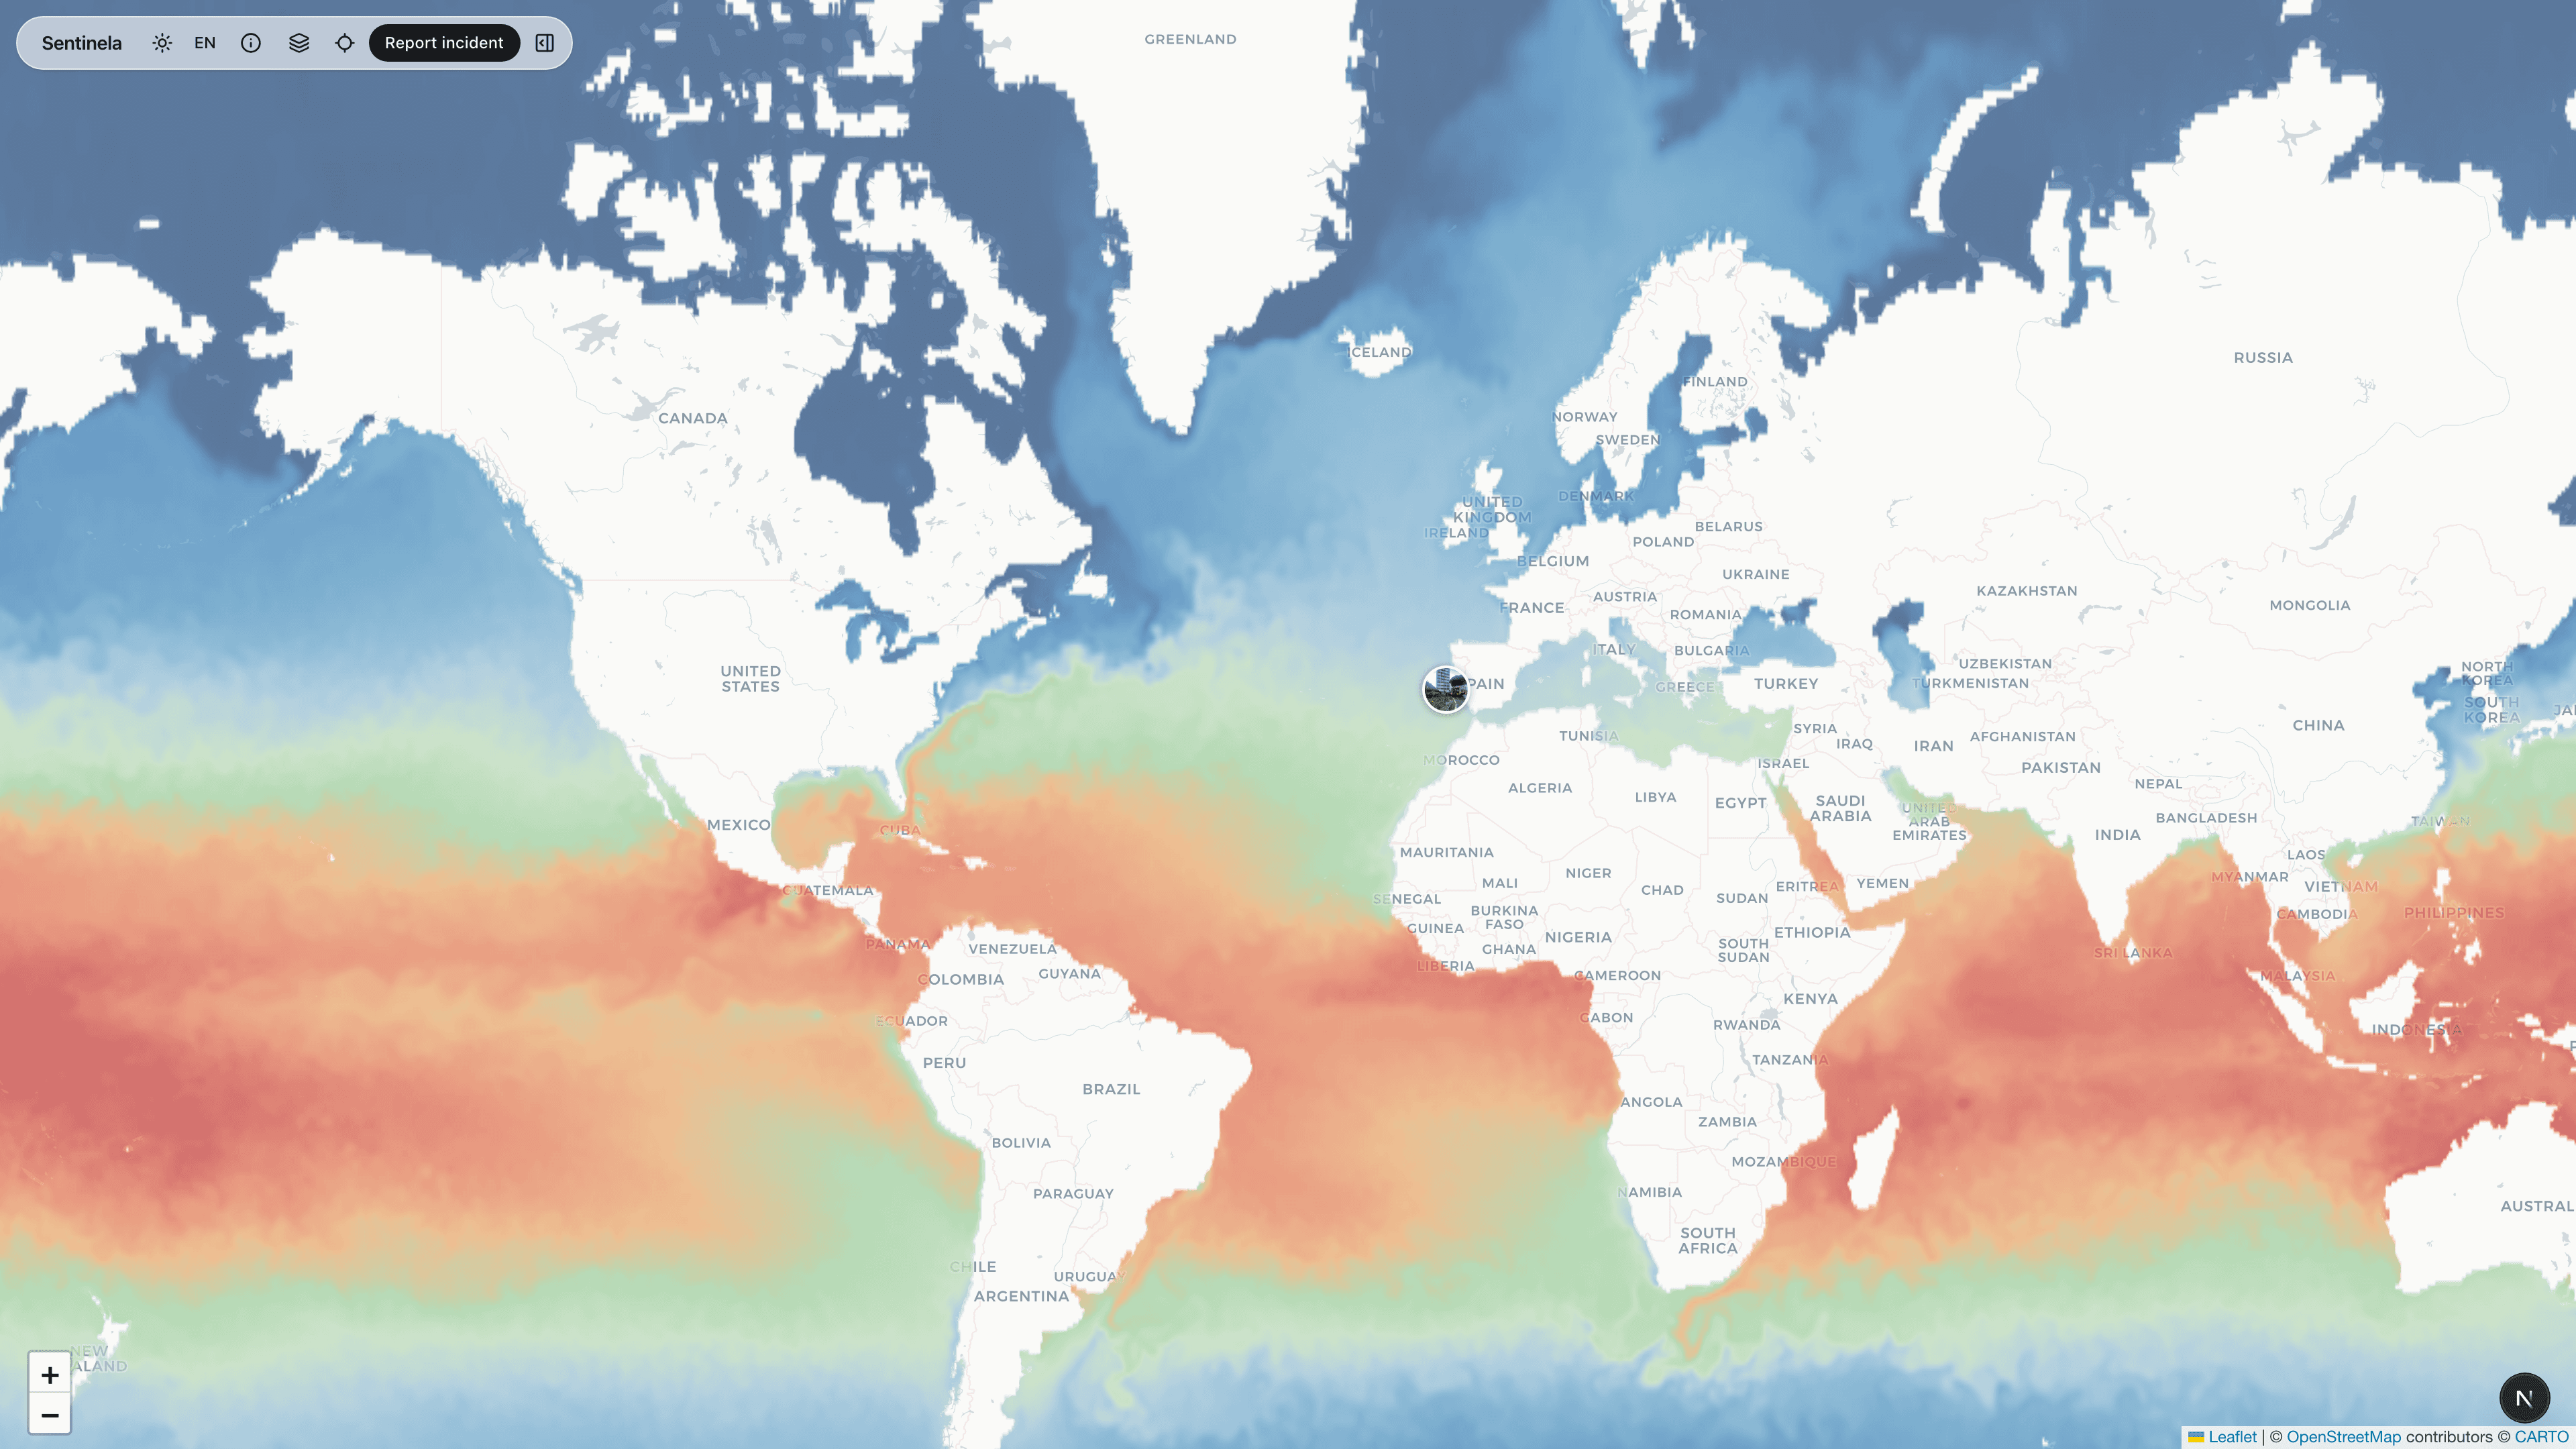
SST is displayed as a color-coded overlay from cold (blue) through warm (green/yellow) to hot (red). Temperature anomalies and patterns like El Niño/La Niña are visible.
Data Processing
Daily SST data is fetched from NOAA and rendered as a semi-transparent overlay. The color scale is optimized to show the full range of ocean temperatures.
Limitations & Considerations
SST represents skin temperature which may differ from bulk water temperature. Coastal areas and regions with heavy cloud cover may have less accurate estimates.