Air Quality
World Air Quality Index (WAQI)
Coverage: Global (station-based) · Update frequency: Hourly · Format: JSON
Overview
The World Air Quality Index (WAQI) project aggregates air quality data from monitoring stations worldwide. We display PM2.5 (fine particulate matter) concentrations, which are the most relevant indicator for health impacts.
How Sentinela Uses This Data
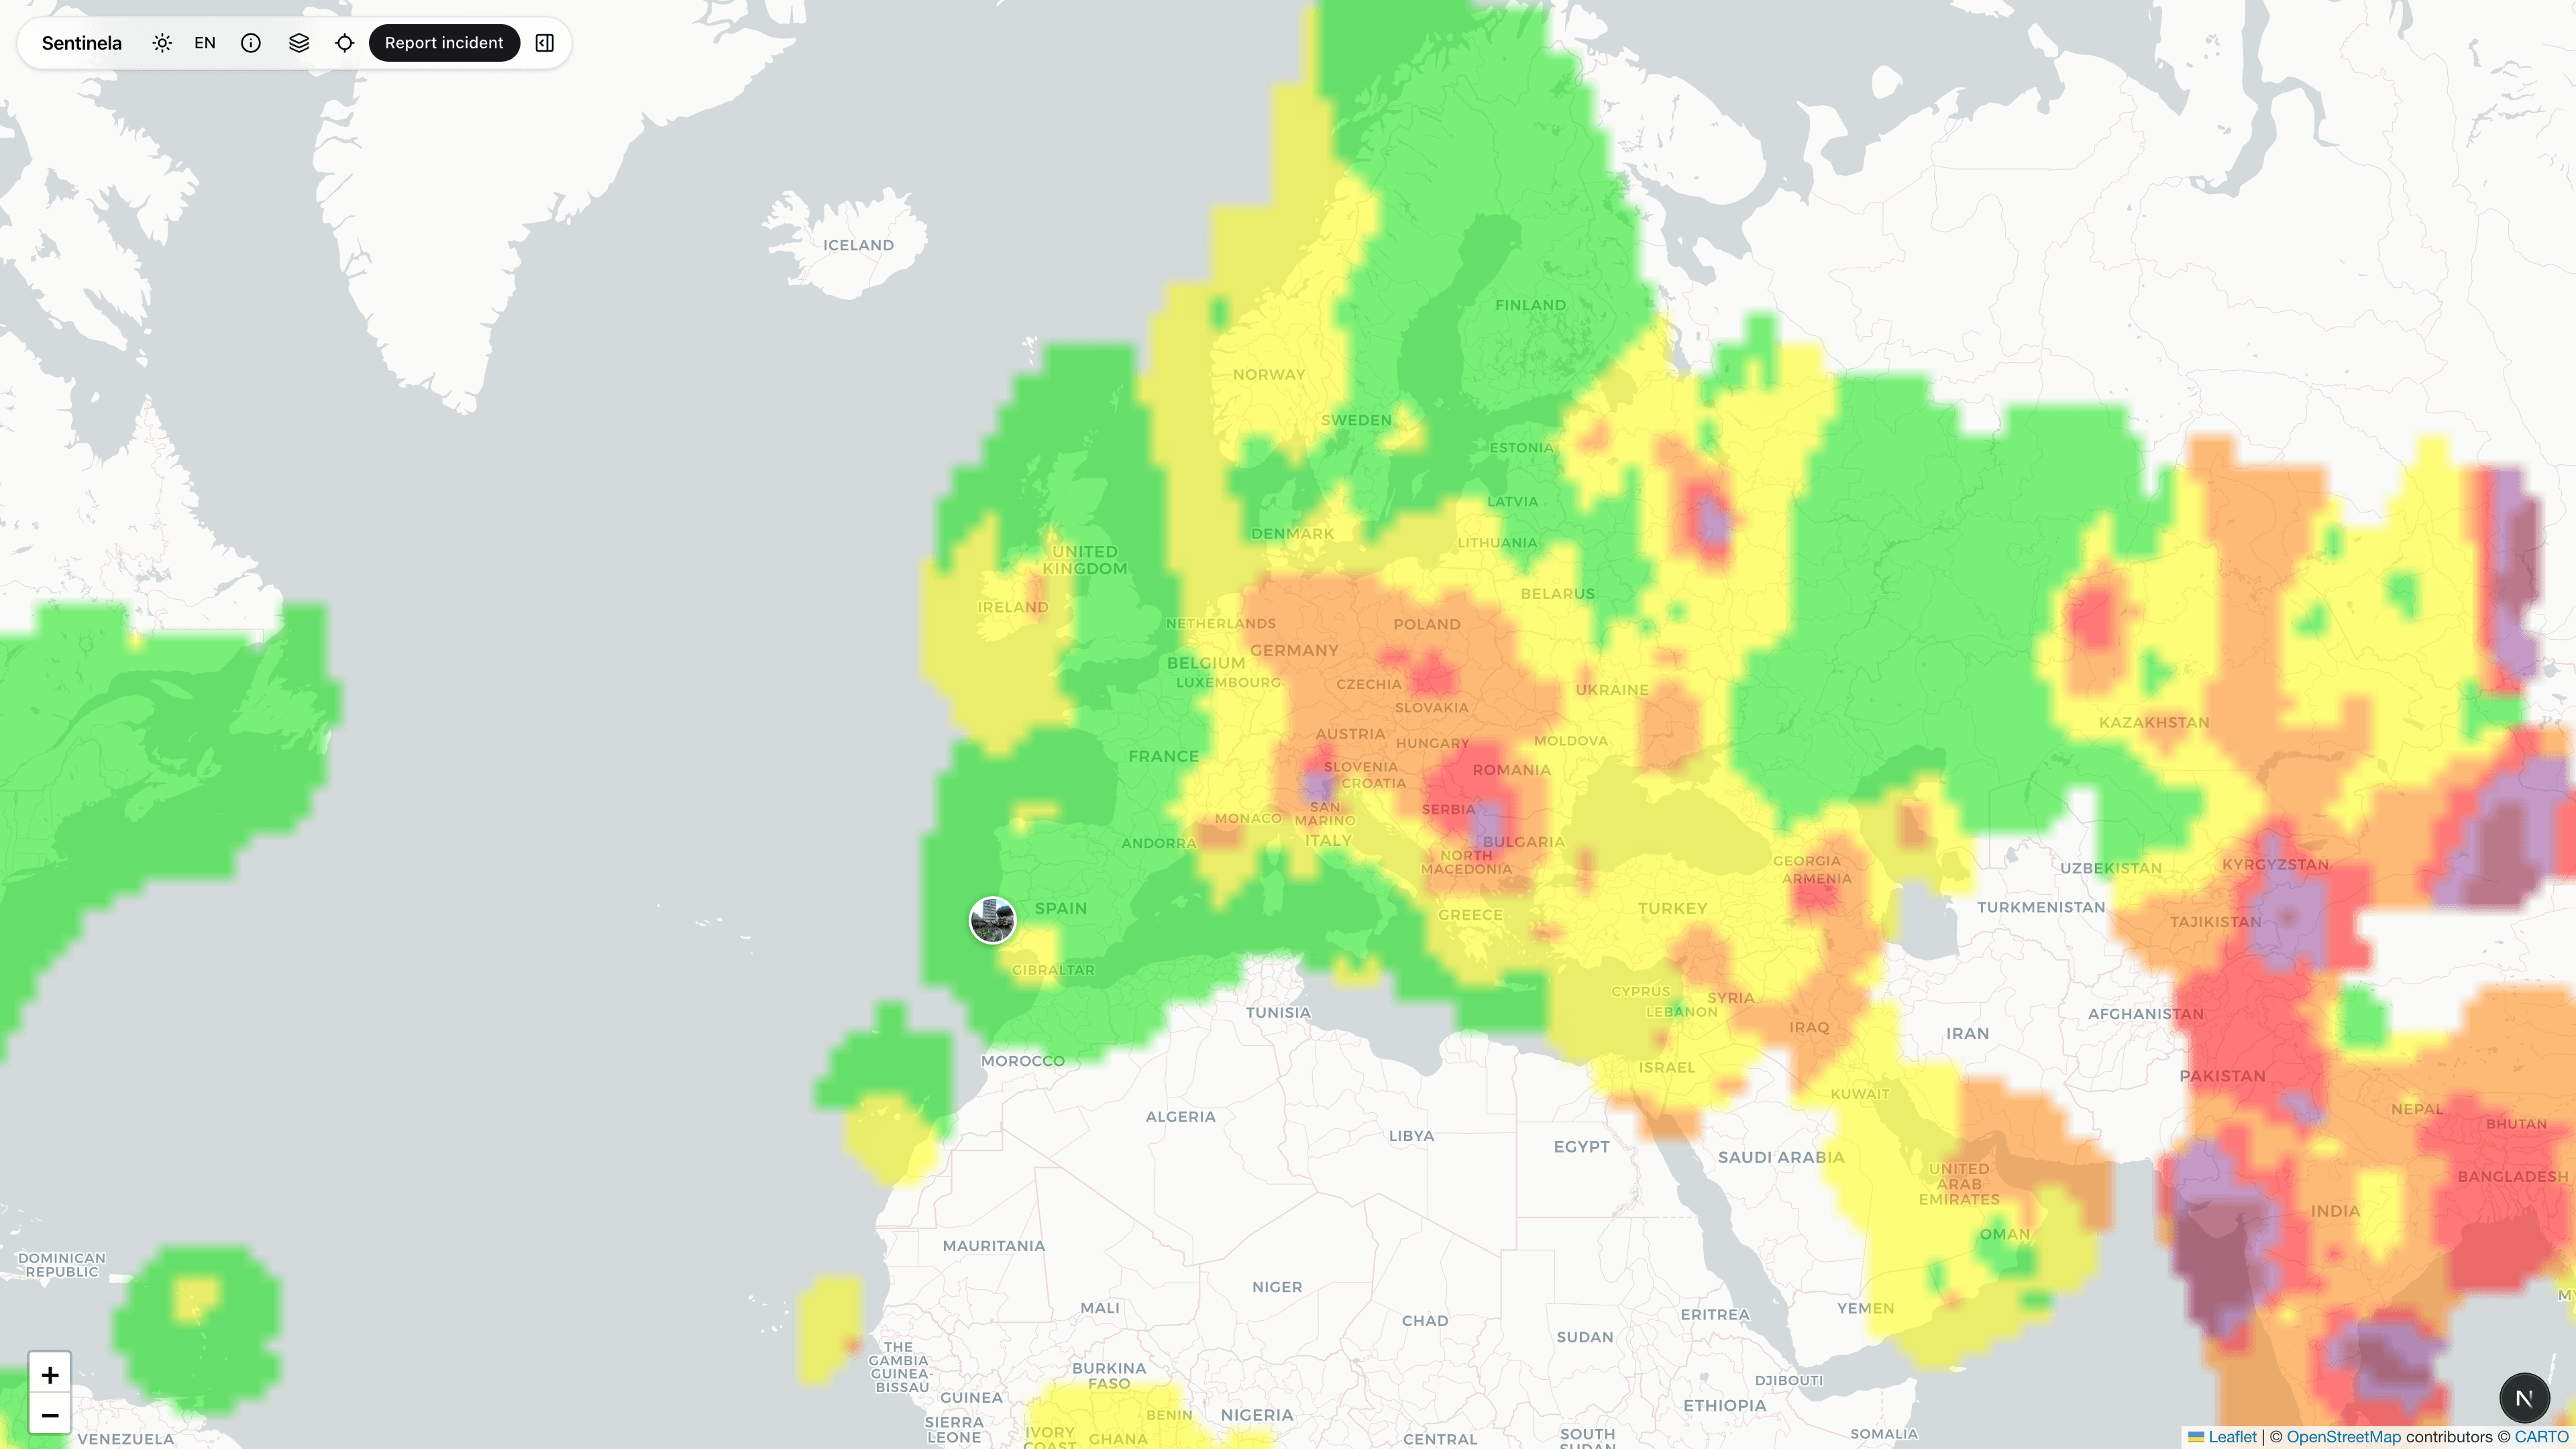
Air quality stations are displayed as markers colored by AQI level. We use inverse distance weighting (IDW) to interpolate between stations and create a continuous pollution map.
Data Processing
Data is fetched hourly from the WAQI API. We interpolate PM2.5 values across a grid and render as a semi-transparent overlay. AQI categories follow EPA standards (Good, Moderate, Unhealthy for Sensitive Groups, etc.).
Limitations & Considerations
Station density varies greatly by region - urban areas have better coverage. Interpolation between sparse stations may not reflect actual conditions. Indoor air quality may differ significantly from outdoor readings.